Visualizations, like any research product, should contain bibliographic hyperlinks to sources and transformations. (Click to englarge.)

I want visualization to be less a part of a specific application that I go to and to be more of a natural extension to the computer itself, available from everywhere. I want visualization to an ambient experience. When I encounter any table of data in any document container I'd like to be able to quickly view it as a column chart without starting up a chart-making or data processing application, without shuffling around through copy & paste. I just want to select rows and columns an pop a "window" with a chart in it in one easy step. If I can recognize with my eyes that a table contains place names or lat/lon pairs then a computer ought to be able to map it with minimal intervention on the part of the user. I should also be able to put my selected, obviously geospatial data on a virtual Earth model. With just a little more imagination I can see turning lists and tables into nodes and edges, viewable with graph layouts. Think Enso for visualization. I might want to do more than just look at my chart, map/Earth model, and graph. I might want to start to interact with these views (assume independently for now). It starts to seem like I need an application to do that, but I'm not ready to jump the gun. This is still in the realm of a capability and not necessarily an application. Applications start to assume containers and domain-specific use cases. Most visualization techniques have standard, "off-the-shelf" things you can do with them given basic commands or input devices. Charts can be sorted and transformed into different layouts. One can pan, zoom, and rotate maps and terrain. The technique of "drill-down" and "roll-up", which can be applied to any visualization technique, is nothing more than navigation of linked data at multiple levels of detail and sometimes across multiple view contexts. At what point do is a specialized application needed more than a capability? We may be overly conditioned to assume the application model when we think of software as having utility. This is changing rapidly on the web. (It was always thus on the Unix command line, yes?) Visualization ought to change with it. Leave the application building up to subject matter experts with an application domain, not to software programmers. Ah but wait, lest too much be read into a passing editorial remark. Obviously software programmers play a key role here. The tendency among programmers who attempt to answer that call is to build an "application building framework." Again, the assumption is that subject-matter experts always need an app to make use of viz. I wonder why visualization software shouldn't be a part of an operating system; a core capability for any application or purpose. There have been wonderful advances made through web browser extensions, but even here visualization is at best an after thought applied to a mostly universal application. (I say "mostly" b/c there are no less than 3 different web browsers installed on my one operating system.) What happens when someone emails me some data in a flat file that I open in a text editor? Instead what is need are document object models for visualization techniques and runtime software that can parse viz documents on the fly. The runtime is optimized for robust interaction and attribute manipulation of high level visual artifacts, not application-specific tasks. This runtime can be invoked from a background process or "embedded" (contained in, called from) an application runtime. Devices having different display and user interfaces can choose how to represent what are otherwise well understood visual metaphors. Data can be more easily passed around and visualized simply by passing text documents describing interactive, dynamically updatable (or not) views. (This seems inherently more secure, too.) Only this way is ambient visualization possible; something that is available everywhere on my computer, no matter what kind of computer/device/hardware platform I am using.
A colleague, Anthony Watkins, and I recently conducted a feasbility assessment of ETL-V applied to a DoD tactical simulation called JCATS: Joint Conflict and Tactical Simulation. JCATS was created by Lawrence Livermore National Labs in 1997 and has been supported in some fashion or another ever since. JCATS is not unlike other military sims I've encountered over the years; OTB, TDF. In fact, JCATS is generally not unlike all other models and sims with which I have worked in the past 11 years - aerospace apps, power/energy sims, custom apps.I AM NOT A MODELING AND SIMULATION EXPERT. I took a class in graduate school, did pretty well. But I studied Computer Science and Applications. That's my slant.When I reflect on my scant 11 years of experience designing, developing, implementing, and integrating business processes and software - a fair amount of it in the M&S domain - I come to one conclusion.Interoperability stinks.A bit of personal history on why that I think that - three words: separation of concerns. As in, we haven't maintained it. I observed the problem in my first job at ODU Research Foundation, Center for Coastal Physical Oceanography: oceanographers were writing code...bad code. Eventually the computer scientists got involved, but all we did was write occasionally elegant code wrapped tightly around a domain application.Then, in September of 2001, I found Object Serialization, Reflection, and XML all at the same time (XML, casually, in '99). My colleagues and I were using these to create 3D visualization, behavior, and human-computer interaction for the Web. With the introduction of XML-RPC we were communicating with "back end" data services to drive client-side 3D. The 3D applications were entirely dynamic without compilation, the same way all other content was being delivered over HTTP to a standard browser. It was cooler than dirt. Along came Web Services, circa 2003-4 for us. Finally, everything was starting to click.That brings me back to models and simulations as data and where I am in 2009. Simulations aren't applications, they're data sources.I've written previously about how we use enterprise architecture models as data sources for analytics. It's basically the same thing for sim integration. There is one additional component. Simulations often stream data in real time. The transactional model of the Web and relational databases is not always sufficient. Regardless, the methodology is not dependent on transfer rate or protocol. The methodology is based on separation of concerns. The difference between yesterday and today is that we realized how to take what were doing above the level of a single application.Most of the applications with which I am experienced are heavy...very heavy. Whether we are talking about footprint, documentation, training, number of participants, facilities, or duration most simulation apps require a lot of it. Technology insertion and training are costly. Learning curves are steep. Exposure and knowledge is limited to very small groups.It doesn't have to be that way, either.[Update: 12/10/08 - Well, maybe it does. I appreciate that M&S is hard and hard takes time. The point I really want to make is that we can and should reuse the data generated by M&S to increase their ROI and overall value of their insights as information assets. We do this by decoupling their data so it can be more easily integrated with other things - things people who aren't modelers or enterprise architects care about.]If I could wave a magic wand, I'd strip every simulation down to it's algorithms and databases. To be sure, there are some sweet front-ends out there, but they aren't maintaining separation of concerns.JCATS, for example, is a powerful tactical simulation. There are good smarts in there. But JCATS has a limited graphical user interface (2D) and is strictly designed for tactical operational scenarios on maps. While the designers of JCATS may have thought about 3D and some statistical diagnostics, they certainly did not, nor could they have anticipated or accomodated all the many ways we can use the output of JCATS simulations.The good news is that JCATS saves huge DAT files, i.e., data files, i.e., JCATS data is portable. JCATS produces ordinary delimited text files (comma-separated) and puts similar data on the wire in real time (either TCP/IP or UDP, I think).From here it's easy:


Enterprise architectures are more than static structures, use cases, and process/sequence models. Enterprise architectures are also queryable data sources that, once constructed, can be used to answer a great many questions relevant to decision making based on multiple stakeholder concerns; operational, technical, financial, logistical. In my experience, this assertion usually surprises people. Operators want to know what complex (in their minds complicated) EA models have to do with getting the job done. Appropriators want to know how system producer-consumer dependencies relate to purchasing decisions. To anyone unfamiliar with enterprise architecture, EA can be seen as not only having no value, but as an unwelcome cost burden. Yet, each of these perspectives is relevant to an enterprise architecture. Many architects understand this problem but have been helpless to address it. Enterprise architecture is a rigid, rigorous discipline. The language and views of architects are complex and detailed. The tools architects use are highly specialized. All of this contributes to formidable barrier to information and knowledge sharing.


 Recognition of a pattern in a graph is a curious thing. On the one hand, if patterns can be seen among relationships of nodes by their edges, then relationships exist whether or not they can be seen with the eye. In other words, the relationship is inherently mathematical and can be conclusively tested. On the other hand, decision making is not strictly binary, i.e., does the relationship exist? yes/no. Even when decision making is highly quantitative it is most often multi-dimensional. This is where graph visualization comes in. There is significant utility in having the capability to see multiple data dimensions simultaneously by affecting the many attributes of graphical objects. When people are considering multi-dimensional problem spaces then they are engaged in a level of thinking that is poorly supported by low-level primitives (ex., tables of numbers). Decision-making based on tables of tuples is no way to go. Pattern recognition is mind numbing. The best we can do is perform operations on rows and columns; counting, sorting, grouping, filtering. While these are immensly useful and powerful, they overlook the possibility that patterns exist among the atomic, non-aggregate entities themselves. Furthermore, we don't know what they are until we see them and therefore cannot apply operations a priori. On the other hand, given layered, multi-dimensional graphics we can map these many atomic attributes of abstract data to the attributes of graphical objects. Then we can use operations for manipulating graphical attributes to reveal patterns. This is particularly useful in graph visualization, i.e., of networks:


Loads a 3D Lightwave model:
http://dev.bridgeborn.com/bwschools/BwContent/01_LoadBox.xml
Describes a stacked column chart:
http://dev.bridgeborn.com/bwschools/BwContent/3DChart_SingleRow_Stacked.xml
Describes a force-directed graph (of a caffeine molecule):
http://dev.bridgeborn.com/bwschools/BwContent/ForceDirectedLayout_CaffeineMolecule.xml
Try them out here:
http://dev.bridgeborn.com/bwschools
(IE only right now, sorry)
Following is a draft section from an in-progress whitepaper on ETL-V:
The key to enabling visualization as a core capability is robust description of functionality that is machine portable and parsable through a universal processor that enables the serialization and deserialization of any object, attribute, and behavior in a standard way. Such a description captures the language of visualization in a way that can be understood by any program or person.
Our machine portable language is not intended to express low-level artifacts like vertex points and surface normal vectors, although it can. Most often we follow the model of HTML, which uses URLs to reference images, movies, and other digital multimedia. A 3D Model is not unlike an image:Our language must be capable of describing attributes having multiple dimensions, for example a 3-dimensional position. We classify attributes as belonging to one of four basic categories: primitive, complex, compound, and collection. These are defined as follows:
Given this language, we can express any visualization technique, behavior, or interaction style as a human and machine readable document capable of being interpreted at runtime. To demonstrate our concept for this machine portable language, we have created Bridgeworks Markup Language (BML). BML is defined using Extensible Schema Definition language (XSD). Documentation and source schemata are available online in the following locations:
http://dev.bridgeborn.com/Bridgeworks/Schemata/doc/Bridgeworks.html

I have learned much from the work Stuart Card and Jeffrey Heer. It was their research on graph layout algorithms that made possible the modularization of graphing capabilities in software. Heer's premier software implementation of this research is Prefuse. Computer Science taught us Graph Theory and the structure, manipulation, and traversal of nodes and edges. Prefuse taught us Radial Tree, Force-directed Graph, and Degree-of-Interest Tree. And Prefuse is excellent not just because it good at graphics and layouts but because it is also document-driven, i.e., it runs on XML. Sure, there's a Java API, and that's probably what most developers focus on. But the fact that it parses XML, that it recognizes a vocabulary and language for visualization, and that this language can be expressed as documents is what I think makes Prefuse special.
After Prefuse came Flare. Flare is a wonderful application of prefuse ported to ActionScript.
Flare really gets document-driven visualization. I was just browsing through the source when I unfolded the data/converters package: See also (emphases added by me):
This is certainly familiar.Class Description Converters Factory class for looking up the appropriate IDataConverter for a given data format. DelimitedTextConverter Converts data between delimited text (e.g., tab delimited) and flare DataSet instances. GraphMLConverter Converts data between GraphML markup and flare DataSet instances. JSONConverter Converts data between JSON (JavaScript Object Notation) strings and flare DataSet instances.
I came back from a recent DARPA workshop ever more convinced that visualization as a core capability is both necessary and attainable. "Visualization as a core capability" means that the full spectrum of visualization techniques is available from any application. It doesn't involve so-called "pluggable" components; no automatic code generation to force big-bang integration between heterogeneous apps, tools, and APIs. Anywhere I come across some columns of data I ought to be able to generate a chart. If I can recognize that columns of data are latitudes and longitudes then the computer should also make that recognition and generate a map. The chart and the map should be independent of any application and at the same time embeddable into any application. I am increasingly of the opinion that we need visualization built into the operating system as a platform service.
I love that people continue to add relevant and useful information to 5 year old threads on Edward Tufte's bulletin board. It happens all the time. Talk about a simple and effective lessons learned resource...


Sense-making matters. I've always been cognizant of the fact that people without sight have exactly zero use for visualization. (Probably not 100% true, I bet.) The point is that there is nothing presumptive about visualization that makes sense-making possible. It is the human mind that makes sense-making have even meaning enough to give way to possibility. Communication matters, too. Certainly visualization makes communication possible by providing an entire medium/channel/wavelength such that when we lack it our communication may likely be impeded.
Obviously I think there is value in visualization. So why do I say it doesn't matter? Because visualization is never more than a means to an end. That end could be to have fun or it could be to make an important decision or it could be to send a message. But in any case, there can be 1001 means to achieving those ends and visualization is never more than one of them.
Why is this point worth understanding and remembering?
Selling. Working for customers. Providing a service to people. I am a computer scientist and a technologist and a visualization "guy" but my work and my business are all about people. Sometimes people forget what the word "technology" means.
And so when I'm talking to a customer about visualization and I find that we are talking too much about visualization then something is not right. We should be talking about the customer's wants, needs, pains in intellectual terms that are not constrained by any one means of achieving an end. It's up to me to decide how, where, why, and when visualization matters. That's what I'm getting paid to do.
Ok, so enough with the hand-waving. What is a practical example?
I have a customer who wants and needs to make an investment in visualization and part of his information technology capability. I know going in that the reason I am doing business with this customer is because he values visualization and knows he needs help integrating it into his IT portfolio. So I'm sitting down in front of him and giving him his first brief on what I am doing for him. Most of the hour long presentation (demonstrations, actually) is/are in terms of how visualization is used to present and interact with his domain data. He finds that all well and good in about 5 minutes, but what he really wants to know is "which of my problems does it solve?" And that's where it gets tricky. Because the answer is that visualizing domain information doesn't solve any problems de facto.
So do you want to talk about my visualization services or do you want to talk about your problems? What matters? I'm happy and comfortable discussing either. But in my business, people solve problems and it just so happens that my people are skilled at using visualization as a means toward that end.
Alright, here's the flow on document driven visualization. Documents are the lifeblood of the Internet. Right now everything we experience on the web is tied to documents. If it's Flash it's a document...instructions that tell the Flash engine what and how to render. HTML is a document. Any markup is a document. Even if it's not XML...if it's data, it's a document. Don't argue it, just accept it. Be okay with it because documents are just written communication. What are we doing when we use computers to collaborate if not communicating? So, it stands to reason that if visualization is going to thrive on the Internet it had better come to terms a document model...The Document Object Model, to be specific.
So I realized that the DOM makes for an ideal match to visualization, as I was taught it. I learned visualization programming using SGI's IRIS Performer. Performer was a...no, THE rich, powerful API driving almost every immersive virtual environment on the planet in the late, late 90s (maybe it still is). A central concept in Performer is the Scene Graph. A Scene Graph is made of Nodes. Nodes have Parents and Children. Graphs of Nodes can be Traversed. When Nodes are visited (during Traversal) they are evaluated and sometimes modified. The way we created and manipulated an immersive virtual environment was to add, remove, modify, and traverse the Nodes of a Scene Graph. So, it could be said that the complexity of writing any visualization application can be reduced to the repetitive execution of these operations over these Objects in performance of some domain-specific task. Well, it wasn't sooo easy, but the concept was really starting to gel.
Then I learned about a couple of really handy patterns from the Object-Oriented Paradigm that were in the Java core language. "Handy" doesn't do them justice, in fact. To me, Reflection and Serialization are the most important aspects of OOP. In a nutshell, Serialization is the ability for Objects to write themselves (or be written) out to text (XML) and Reflection is the ability for an Object's Attributes to be Get and Set by name.
Scene Graph has Nodes. DOM has Nodes. (Scene Graph is a Graph. DOM is a Tree. Turns out this is not a constraint that matters.) The fundamental operations on a Scene Graph of Nodes are the fundamental operations on a DOM Tree. Nodes are Objects. Even operations are Objects. Objects can be Reflected upon and Serialized to XML. Visualization Objects can be Reflected upon and Serialized to XML. Visualization is a Document. I don't know if that is a straight line but it seems pretty damn solid to me.
This is powerful. Visualization (and interaction) can be published. Visualization (and interaction) can be transformed. Visualization (and interaction) is interoperable. Visualization (and interaction) can be mashed up. Visualization gets the Internet. (Visualization gets natural language?)
Here are some other important factors:
A. We don't serialize everything to XML. Very rarely do we need to spell out all the vertices and normals of a geometry. 3D models do not need to be XML. To me expressing geometry as XML (some is okay) is like expressing the 0-255 value of every pixel in a bitmap. Do what HTML does with images:
"img src="url/to/image.jpg""
"Model url="url/to/model.lwo""
B. Driving visualization with APIs is powerful and there are plenty of occasions for it. But point-to-point API integration does not scale. You want graphs and maps and charts. Prefuse does graphs. Earth does maps. ChartFX does charts. Have fun coding. Instead, programs should use XML as a standard input/output format. Then at least integrators can use ubiquitous technologies to move and transform data from program to program. Visualization programs can even be written by other software programs. It's just rules producing markup fed to a render context. All of this reminds me of the Unix operating system. But with apps and APIs we still aren't getting to the heart of the matter. Apps and APIs are laden with cognitive artifacts for both end users and developers. Whether we are talking about the presentation and interaction layer or the business layer, apps and APIs all have their own ways of doing things. And APIs really only open up apps to developers (i.e., specifically those who take the trouble to learn the API). XML opens apps to developers (i.e., most any developer who understands how to work with XML) and other apps. We're not so much trying to bridge apps with document-driven visualization. Instead, we're trying to bridge visualization across two extremes. At one extreme is the render context...the canvas on which the computer paints. At the other extreme is the human mind; the mental models we construct, the metaphors we understand. Perhaps it is more accurate to say that we are trying to enable visualization through communication medium connecting two points. There is a language that we will express to describe what we want to see and how it should be rendered and behave, regardless of any tool set or application.
C. Document-driven visualization does not make visualization slow, inefficient, or a resource hog. SAXParsers are lightning fast. XML is highly compressable. Either the render engine is fast or it isn't, but that's not XML's fault. We're only using XML to pass instructions to the engine. If anything, the Reflection and OO in general adds overhead. But getting hung up on clocks and RAM as matters of efficiency is to lose site of all the inefficiency created by so much heterogeneiety. The benefits avoid the costs of having low interoperability and far outweigh the costs of clock cycles and memory.
Ok, that's enough for now.
Update 09.04.08: I have since realized that document-driven can "well-formed Unicode text," and not necessarily XML. JSON is a good example of an alternative. Of course there are trade-offs, too. I considered that here


 One of the outlying nodes is a case of mistaken identity, i.e. the wrong user was added to a friend's network and neither of us know this person. The other outlying node is not a person, but a group. The group is not really used by anyone.
 I built a web app called g.licious that uses graph layouts to visualize relationships in del.icio.us data. I built the tool mainly to test our graphing package in Bridgeworks together with AJAX and web services. Visualization of relationships using graphs is certainly not new. In fact, there has been plenty of criticism of this approach. Indeed, the criticism is not without basis. Regardless, people keep doing it. The reason we keep doing it is because the approach itself is quite sound. Results happen. How people choose to use graph viz is another story. So what is it that makes good graph viz and bad graph viz? Well, I have to say that I can't pretend to know even a tiny fraction of what Jeffrey Heer and Stuart Card know. They defined graph viz. They've studied it more than anyone I know of and that's how I learned. Still, I think my experience has taught me a few things that are worth recording. In the spirit of visualization, I thought I'd start with a few observations from g.licious.
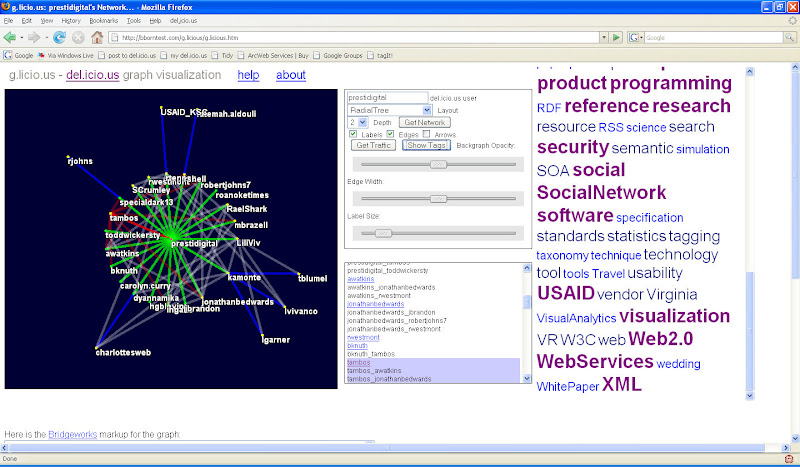
Starting with the basics...here is my del.icio.us network:
The graph layout is called Radial Tree. Radial Tree is a prototypical "degrees of separation" view shown as concentric circles about a center point of interest. Here I'm in the middle ("prestidigital"). The first circle of names around me are the friends in my immediate network. They are connected to me by the green lines. Beyond that are friends of my friends. They are connected by blue lines. The gray lines are called the "back graph." It shows which of my friends and friends' friends know each other. My networks has some quirks. At least one person has two del.icio.us identities. Another name was added as a case of mistaken identity. (Those are topics for another discussion.) This view shows my extended network in one place. It shows me relationships among my friends. That's somewhat useful and interesting. It's more than the del.icio.us network view provides. But that kind of value added is a nice-to-have, not a must-have. The real value of a view like this comes when I use it as a foundation on which to add layers of information, when I use it to ask questions. Here is my network with "traffic": In this view nodes representing my friends are sized according to how many links I have sent them using the del.icio.us for: tag. But then...why do I really care to see where traffic in my network is going? Well, this view answers the question "how much?" So maybe I and my are placeholders for distributor and supplier, producer and consumer, seller and buyer, caller and callee. Conveniently, one of the keys to success with this view happens to be the fact that I have a small network. What happens when I have a HUGE network? Hold that thought. Suffice it to say now that what's important isn't necessarily how much I can see at once, but rather what I can know based on what I see. Navigability through levels of detail is also important. But for now, I want to keep it simple. There's a lot I can learn, pro and con, from this tiny little set of relationships.
This view of my network shows communities of interest:
At the bottom half of the view are researchers and librarians I know that work in the same library. At the top, those who are closest to me are in fact office colleagues, two co-founders of my company, my wife, and one of my closest friends. That seems to say something important. (The graph layout is called a Force-Directed Graph. The general idea is that the edges act like springs.) Now, the thing with this bit of knowledge about my graph is that it seems hard to generalize beyond a specific set of circumstances that occur here. The reason I know how to interpret his view is because it's my network. People in my network might also know how to read it. But what if the relationship is not people?
Here is a view of my del.icio.us tags:
Now, this isn't the greatest view in the world, but I have to keep mind a few things: 1) I made it in a hurry, 2) the picture is really a screen capture of an interactive 3D visualization that is easily manipulated with a mouse, keyboard, or clever software, and most importantly 3) there are plenty of people that can easily identify clusters of keywords that belong together. WSP+music+band+setlist+Virginia locates the setlists from Widespread Panic concerts I attended (in my home state). The dates 2006 and 2007 describe "when" and each points to the show I saw here that year. DoD-.mil-software-certification points directly to information about Department of Defense policies and procedures for getting software certified on .mil networks. There are several other clear relationships in the larger spline to the right.
Ok...so there's a lot to consider here and I'm getting tired. More later... The images here aren't great because they are small. I tried to link to my Picasa web albums. Ironically that didn't work in Blogger (both are owned by Google...again, another story). So here's a direct link.